Raster shader index
This page details the different shaders that can be applied to raster geometry, how to select them, and how to create new ones.
Selecting
To select which shader a raster layer uses change the layer_raster_material property for the layer in the config file (either directly or through the editor) under meta. Setting this value to the name of one of the entries in the table below will display the raster with that shader. If no name is given the game will pick a default shader.
| RasterBathymetry | The default bathymetry shader | 2 |
| RasterMELNew | The MEL shader created by Kevin & Carlos with visibility improvements and optional range of detail | 5 |
| RasterMELOld | The original MEL shader created by Tino | 5 |
| RasterMELCustomizable | New customizable shader (uses colors we set up in the types)
Notes:
|
>1 |
Notes about dealing with raster shaders
Bathymetry raster shader usage
When you have a raster file with a big range of values, and you want to show the very big ones and the very small ones, similar to a log scale, you can classify the data using the classes you want, then use a linear scale of grey for those classes (white being the highest values and black for 0 or 'no data'. Like this, you can display different intervals of data using the "RasterMELCustomizable' shader. This is very useful for bathymetry as users usually like to see depths until 20, then 40, 100, 150, 250, 1000 and more.
This method was used already for the raster layers for the Adriatic Sea version.
Emodnet vessel density layers raster shader usage
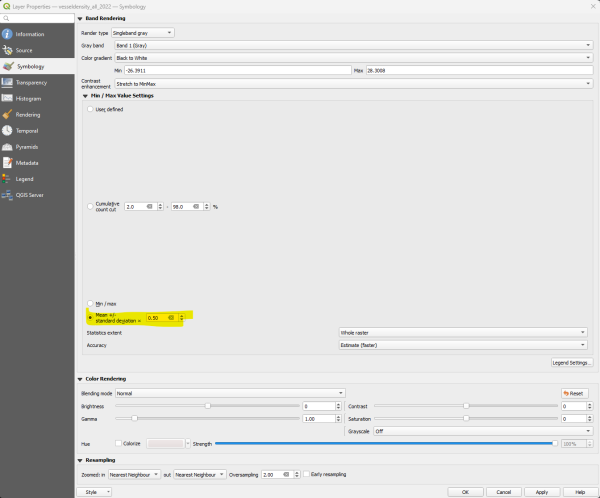
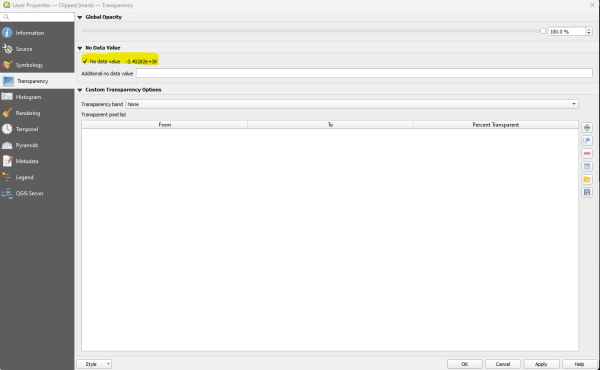
Once you load the layers in QGIS you will not notice where the values are high or low, you need to use the settings below. Nevertheless, the values in the legend will no longer reflect the units of the layer though. So if you need to clip it do that first and then style it and save as a rendered image. Before saving as a rendered image untick the "no data value" to make sure cells without values appear in black in the image.
The style definition file for QGIS is attached and the configurations for the configuration file are below (the important things are in bold).
Here's an example excerpt. Notice the combination of layer_raster_minimum_value_cutoff and layer_type > value definitions.
[
    {
       "layer_name": "vesseldensity_all_2022",
       "layer_geotype": "raster",
       "layer_entity_value_max": null,
       "layer_short": "Total Shipping Intensity (static)",
       "layer_category": "activities",
       "layer_subcategory": "shipping",
       "layer_download_from_geoserver": 1,
       "layer_width": 1040,
       "layer_height": 694,
       "layer_raster_material": "RasterMELCustomizable",
       "layer_raster_filter_mode": 1,
       "layer_raster_color_interpolation": 0,
       "layer_raster_pattern": "Default",
       "layer_raster_minimum_value_cutoff": 360.0,
       "layer_active": 1,
       "layer_selectable": 1,
       "layer_editable": 0,
       "layer_toggleable": 1,
       "layer_active_on_start": 0,
       "layer_tooltip": "Shipping Intensity in hours per square kilometer per month",
       ...
       "layer_type": {
         "0": {
           "displayName": "0 - 0.25 hours/km2/month",
           "value": 360,
           ...
         },
         "1": {
           "displayName": "0.5 - 2 hours/km2/month",
           "value": 467,
           ...
         },
         "2": {
           "displayName": "2 - 5 hours/km2/month",
           "value": 573,
           ...
         },
         "3": {
           "displayName": "5 - 10 hours/km2/month",
           "value": 680,
           ...
         },
         "4": {
           "displayName": "10 - 20 hours/km2/month",
           "value": 787,
           ...
         },
         "5": {
           "displayName": "20 - 100 hours/km2/month",
           "value": 893,
           ...
         },
         "6": {
           "displayName": ">100 hours/km2/month",
           "value": 1000,
           ...
         }
       },
       ...
    }
]
Creating a new shader
To use a new shader for rasters in the Unity client, take the following steps:
- Create a new shader (anywhere).
- Create a new material, using the shader (anywhere).
- Create a new object with a spriterenderer, using the material.
- Place the object in the "Data Visualization/Resources/RasterPrefabs" folder as a prefab.
- Add it to the table above.
Back to the meta configuration schema page.


 Co-funded by the European Union.